Part 3: Day 1 of Your Church Data Program
Series: What You Need to Create a New Church Data Program
Note: This is post three of three in our “What You Need to Create a New Church Data Program” series. Get up to speed with Part One and Part Two.
Leadership buy-in? Check. Church data expert? Check. Discovery Phase and an idea of what to track and how to track it? Check.
So what’s next for your church data program?
Create Your Team
After wrapping up the Discovery Phase, our first step is to help you determine your data team. These are the folks who know where you’re currently gathering/storing data, as well as those who see the bigger picture of how data connects to your mission.
Typically, teams include a big-picture stakeholder (like an executive pastor), an IT or ministry team leader, and the person with the most knowledge of the organization’s data.
Titles for that last person can vary quite a bit, and regardless of the title, we’re looking for the person who will help execute the hands-on, tangible work we’ll do together. This is the person who knows why something is counted differently at one location vs. another. She knows the caveats that aren’t written down because they live in her head. She’s maybe tried to start using data before, but hasn’t had the support to really thrive in that role.
The mission of this team is to create a specific, actionable data program that can help lead change at your church. Membership requires a deep knowledge of your church and its workings, as well as the ability to think beyond current state to what is possible. These people all understand the mission and type of growth you’re aiming toward.
Start – or Refine – Your Data Dictionary
With the team gathered, our next objective is to get everything documented in a data dictionary. This doesn’t have to be a fancy document or tool; even a simple Google doc with shared access will do.
Our data dictionary will capture:
What data is currently being collected
How it’s defined
How it’s collected
Who is responsible for data
Where is it stored
How is it currently being used
Any caveats or historical context needed to know
A simple dictionary page could look like:
Data Point: Weekend Attendance at Physical Locations
Definition: Any person of any age in the building during a service on Sunday
How it is collected: We take a manual headcount of all people of all ages in the entire building 10 minutes into the service. Each ministry area has designated volunteers who are responsible for this task and reporting the number to the head usher.
Responsibility: The host team is responsible for making sure this number is collected and accurate. The head usher is responsible for recording data in the designated system.
Data Stored: Data is entered in the church management system by the head usher before the end of the service.
Currently Being Used: Reports of weekend attendance data are included in our weekly report sent to all of the ministry teams.
Any caveats or historical context needed to know: We used to only count people in the sanctuary. We didn't start counting everyone in the building until June of 2017.
Design the Dashboard – and Make It Easy to Use
Using the data dictionary as our guide, we start building dashboards that are usable and easy-to-understand.
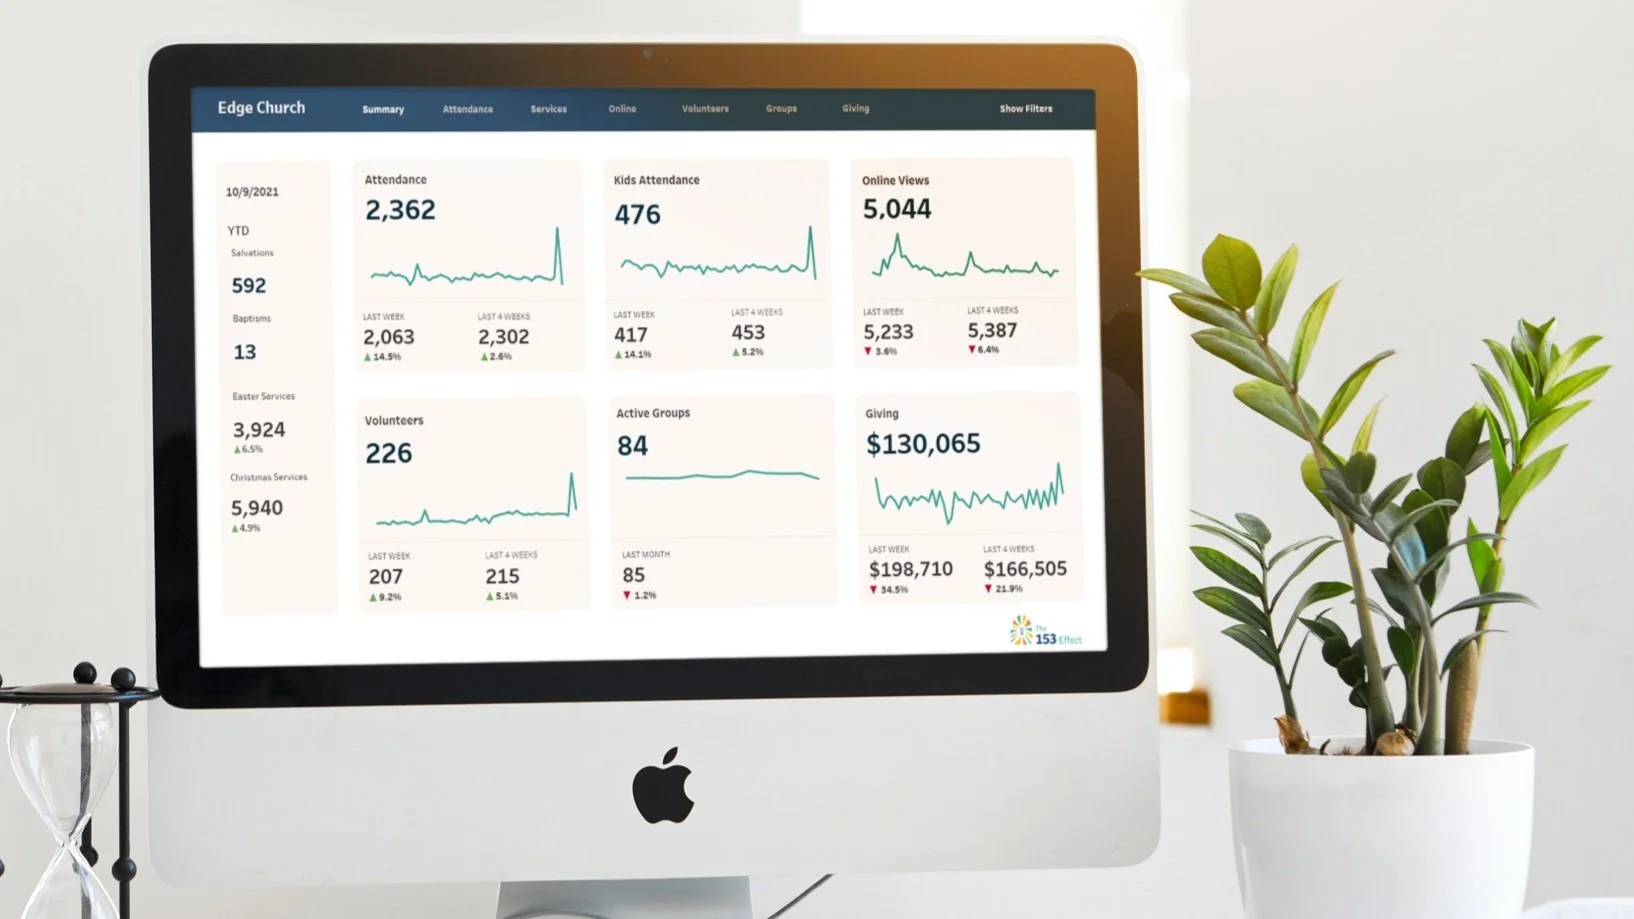
Together, we’ll identify the top 6-8 metrics to place on a summary view. Here, you’ll see last week's number, a trend line for the last 12 months, the variance of this past week to the prior week, and the variance of this past week to the average of the last 4 weeks.
Why all these numbers? Context is one of the most important tools in data visualization. Seeing not only the current numbers but also trends and how current numbers compare to past weeks helps us ask questions and better understand fluctuations. (Check out the example below for what we mean.)
Part of creating meaningful dashboards is determining how to gather the data in an accurate, automated way. What that looks like will depend on what systems you currently use – and if you’re not using a data system yet, we will create one that is streamlined and easy to maintain. It will automatically feed into the dashboard as new data is entered, which helps to ensure the system you invest in creating is actually used!
We don’t go off to create the dashboards in isolation after talking with you. We’ll work with you and your team throughout the entire development process, and each member of your data team will be able to dig into each metric from the central dashboard.
Most importantly, we will help your team understand how to use the data to make better ministry decisions. Not only will you gain access to your data, you will be taught how to make your data meaningful for your church.
Beyond Day 1
We believe data programs are much more than “one-and-done” efforts. They evolve and grow as each church grows, and The 153 Effect is your compassionate guide for the long haul. Together, we support your data strategy and management on an ongoing basis, including adding new ministry efforts, designing additional dashboards, reviewing data strategy, and other continuous improvement measures.
There’s so much to uncover for your church and so much growth to be found from using data and discernment in your ministry efforts. Let’s get started!

